The effectiveness of assessing power usage effectiveness
Data centres and data rooms use a lot of energy, but how can the effect of energy-saving measures be assessed? Monitoring the power usage effectiveness (PUE) is one approach. Richard Clifford of Keysource explains what is it and why is it useful.
For a few years now the data-centre industry has been moving towards a standard measure of effectiveness for the use of power within data centres. Power usage effectiveness (PUE), whilst not yet a globally agreed measure, is fast becoming the standard, and formalising the calculation is well underway. But what is it and why should you bother?
 |
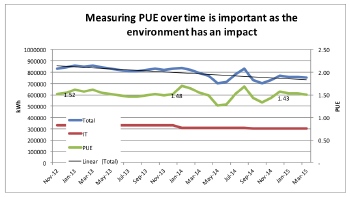
| Fig. 1: In assessing the effectiveness of energy-efficiency measures, monitoring PUE over time is important as the environment has an impact. |
PUE when considered as partial PUE (pPUE) enables even small enterprises to gather data, measure and report the effectiveness of their data centre or data room in terms of power use.
In simple terms, PUE is:
• total energy used in the facility divided by the
• energy used by the IT equipment
PUE will clearly be greater than 1, but the less it exceeds 1, the more efficient the data centre or data room is.
The difficulty for many businesses is the availability of the data and information required.
Whilst assumptions can be made and data captured at different points, comparing PUE or pPUE across market sectors is difficult. However, the real value of PUE is to give anyone with one or more data centres or data rooms the ability to measure and compare the effective use of power across the business and over time — rather than to create a global league table and winners awards.
PUE gives everyone the ability to measure and improve the use of power in their data centres, so what should be included in each group for the calculation? Refer to the table below for suggestions.
Whilst the total energy used by the facility can often be gathered at source from the utility meter supplying the facility, the data for the energy used by the IT Equipment will be more accurate the closer the source of the information is to the individual units that consume the power.
PUE and pPUE account for this within the standard definition by allowing three levels, 1 to 3, with level 3 being the most accurate. The frequency of measure also increases with each category: PUE Level 1 requires monthly or weekly measurements; Level 2 requires daily or hourly; and Level 3 requires measurements at 15-minute intervals or continuously.
Given the lack of consistency in measurements and environments, it is not valid to quote a ‘world-class PUE’.
|
Table: The information needed to calculate the PUE of a data centre. Total energy used by the facility Lighting, power for generators, switchgear, UPS units, rack and power distribution units, chilling and cooling, air-conditioning units, fans, heaters, pumps and dehumidifiers, fire and security systems and sensors and so on — plus the IT equipment listed below. Energy used by the IT equipment Computers and servers, storage, monitors, laptops and any peripherals such as printers, external drives, power USB hubs, routers, telecoms hubs and distributors and so on. |
However, it is generally accepted that a PUE of 1.6 or less is considered good and less than 1.4 is considered very good.
A PUE of 1 means that 100% of the energy is used by the IT Equipment and therefore the physical data centre is 100% efficient (which is impossible to achieve with current infrastructure). A PUE of 2 or less would mean that 50% or more of the power used by the data centre is used by the IT equipment.
It is also important to take into account the different environmental conditions of different regions. As such, PUE levels cannot be compared across regions because a higher PUE in one region might be relatively better than a PUE in another region.
Remember, the key is consistency; define your measure, data sources and frequencies and stick with them.
The fictitious example chart (Fig. 1) shows Level 1 PUE gathered each month for more than two years. It is clear from the chart that two positive steps have been taken to reduce the overall energy used by the IT equipment, but the steps taken to reduce the total energy used in the facility are masked by environmental factors. We can see that the energy used fluctuates with the weather as summer heat as well as winter cold has an impact on energy use, so month-on-month comparisons are misleading.
The general trend is clear, though. Energy use is being reduced, and IT energy use is also being reduced. If we look at the PUE for November 2012, 2013 and 2014 we can also see an improvement.
Measuring, reporting and comparing the PUE or pPUE across a business’s data centres enables the effect of changes to be verified and tracked. It is possible to track real improvement, but a reasonably large data sample should be gathered before any conclusions are made.
Richard Clifford is data-centre consultant with Keysource.


