Finding the performance gap

Nobody understands why there is a difference in performance, between design and the building in-use, but BRE is working on a project to find out — as Dr Andy Lewry and Lorna Hamilton explain
We have the ability to design good buildings and the knowledge to operate them in an effective and efficient manner — so why doesn’t it happen?
The construction industry has in general been ‘designing for compliance’ using software with ‘standardised driving conditions’. We know how to build buildings with good performance but the issue seems to be having the design feed through to performance-in-use (1).
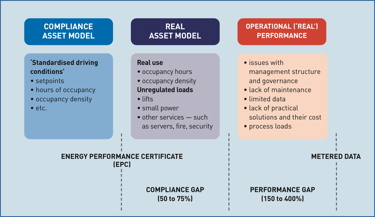
This has led to what has been termed the performance gap. In reality this has two components (Fig. 1).
• The compliance gap.
• Actual performance gap.
The overall gap has been estimated at 200 to 450% (2), of which the modellers estimate 50 to 70% is the compliance gap(3) and can be solved with more realistic modelling mirroring the conditions in operation more closely.
However, the underpinning reasons for the second and larger actual performance gap are generally unknown. There is a lot of speculation and hypothesis but little investigation and hard evidence.
Management of real estate investments is aimed at maximising property value and return on investment (4) via:
• Effective risk management;
• Efficient property management;
• Identification and implementation of valuable improvements.
A high-performing building generates maximum profit via:
• High and continuous rental income;
• Low operating and maintenance cost;
• Low depreciation.
However, poor operational management undermines the aims of asset management and leads to:
• Increased tenant complaints regarding comfort conditions and loss of reputation;
• Higher service charges;
• Longer void periods, leading to a reduction of income;
• Lower and shorter rental values, as a consequence of high service charges and poor comfort conditions;
• Capital expenditure on HVAC equipment failures, due to poor maintenance;
• Tenants wanting to renegotiate rent values based on maintenance issues.
On a pure cost basis the operational energy or the energy used in using a building is up to 50% of the operation costs or 40% of the total cost of a building. If this is inflated by a multiple of 2 to 4.5, the cost to the end user is considerable.
 |
|
Figure 1: The difference between design and the building ‘in-use’. |
The effect on the asset and its value is just as dramatic with:
• Deterioration of value;
• Service life of plant reduced;
• Fabric lifetime reduced;
• Costly remedial works to maintain value;
• During ‘void’ periods there is likely to be still further deterioration through lack of use;
• Loss of reputation.
BRE has previously attempted to close the gap by using the Green Deal Tool to map Energy Performance Certificates (EPCs) onto meter readings (5). Although this approach has merit, the sliding energy-management scale has little underpinning research to support the assumptions, and no verification has been carried out to support these judgement calls by expert groups.
Anecdotal evidence from the asset management industry has indicated a number of possible reasons:
• Issues with the management structure and governance;
• Lack of maintenance due to resource and skills shortage;
• Limited data;
• Lack of practical solutions and their costs.
However, the real truth is that nobody knows, and this presents an opportunity for whoever finds the evidence for the underpinning causes and then presents practical solutions to solve them. The main barrier to this is quality data from a large-enough sample with full access to the building and their occupants; we have now been presented with that opportunity. What was missing is ‘real-life’ exemplars to investigate the actual causes of the performance gap and propose practical solutions.
This proposed research project is in two stages. The first stage is to define the methodology using trial buildings to determine the correct data to collect and the right questions to ask. A proposed second stage will roll this out over a larger number of buildings.
The objective of this project will include the following.
1. Scope proposed buildings and choose a suitable exemplars for the purpose of collection and analysis of metered, asset and energy-audit data.
2. Using the results, from above, propose reasons for the performance gap, produce operational and asset recommendations, and model the benefits.
3. Based on the learning from these trial buildings, produce a methodology that can be rolled out to a larger number of buildings.
4. Propose a second phase covering more office buildings, which covers the breath of the building stock in this sector and aims to produce a tested generic methodology for the office sector.
The proposed methodology includes the following.
1. Scope proposed buildings and choose suitable exemplars (Fig. 2).
2. Hold an inception workshop for each of the buildings, along with targeted follow-up, to map the data and produce a data gap analysis. From this and consideration of the other research questions produce a full project action plan for the project.
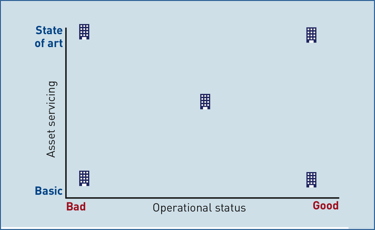 |
| Figure 2: Choice of five exemplar buildings to give a selection of standards for asset servicing and operational status. |
3. Produce the modelled data in the form of an NCT file from the Interface to Simplified Energy Model (iSBEM) software.
4. Determine any data gaps and proposed how they will be filled.
5. On the basis of the gap analysis above, install and commission sub-metering if required.
6. Collect additional data if required, especially with respect to energy management activities —this will include the use of ‘energy matrices’.
7. Analyse the modelled data and input into the Green Deal Tool along with energy-management, operational and bill data (5) to join the asset and operational data up. If possible carry out a calculation of the lift energy usage.
8. Analyse the metered and produce energy profiles (6) for day/night, weekday/weekend and seasonal. Look for high base consumption and any unusual usage patterns. Compare to the Real Estate Environmental Benchmark (REEB) for energy; these are produced by Better Building Partnership.
9. Carry out a targeted energy audit, in line with BS EN 16247 and best practice to investigate user behaviour, investigate working practices (including maintenance regimes), and examine high and unusual energy consumption patterns.
10. From consideration of the analysis of the asset and operations data, use the Green Deal Tool to run recommendations based on business case parameters and best practice.
11. The methodology will be based on the learnings from the trial buildings and aims to streamline the process with the aim of designing a second phase where this will be run out over a larger number of buildings to produce a statistically significant sample which covers office buildings with a full range of servicing and age.
References
1. UK Green Building Council Task group report – ‘Delivering building performance’, 11 May 2016, http://www.ukgbc.org/sites/default/files/UK-GBC%20Task%20Group%20Report%20Delivering%20Building%20Performance. pdf
2. Innovate UK — ‘Building performance evaluation programme: getting the best from buildings — findings from non-domestic projects’, January 2016, https://www.gov.uk/government/ publications/low-carbon-buildings-best-practices-and-what-to-avoid
3. CIBSE Building Simulation Group event, ‘IES Faculty: intelligent big data in building services’[, Dr. Naghman Khan, IES, London, 27 April 2016.
4. Mind the gap: quantifying principal-agent problems in energy efficiency, International Energy Agency (2007), https://www.iea.org/publications/ freepublications/publication/mind_the _gap.pdf
5. A. J. Lewry, ‘Bridging the performance gap — understanding predicted and actual energy use of buildings’, BRE IP 1/15, February 2015, IHS press, ISBN 978-1-84806-408-9, http://www.bre.co.uk/energyguidance
6. Lewry, Andrew J, Energy management in the built environment – a review of best practice. BRE FB 44. Bracknell, IHS BRE Press, 2012.