Maintaining standards
How well is your building operated and maintained? Those questions can be difficult to answer in isolation, but PADDY HASTINGS describes a scheme to enable companies offering such services, and their clients, to compare their performance.Organisations are curious on how they benchmark themselves and compare their performance to others in the same or similar industries. Service providers and in-house non-core support departments may be required to work to key performance indicators against service level targets to enable the core business activities to function without interruption within cost effective and efficient parameters.
Performance measurement To overcome this curiosity on performance measurement, an organisation can either establish a type of quality-control assessment of its own delivery of services and compare like for like to the contracts or buildings under its control or join a benchmark network. Joining a benchmarking network adds another dimension to performance measurement, as it will gives insights into your competitors’ performance as well as your own and can help you set your own improvement targets. The BSRIA Operation & Maintenance Benchmarking Network was set up in 2001 and is now entering its fifth year. Benchmarking can be used to optimise your performance and identify areas where you can: • reduce costs; • improve efficiency • improve service; • save energy.
Compare This benchmarking network allows you to compare performance with other companies in the same and other sectors. It is based on mutual co-operation and confidentiality between members and is operated on a ‘give-to-receive’ approach. The data gathered in 2004 has been the best so far, with network members submitting data on 91 buildings. The raw data has been split into size and type of building and is available only to benchmarking members. An overview by building type for the cost of maintenance in £/m2 per annum and energy costs £/m2 is summarised in Figs 1 to 3 and explained further below. The raw data includes buildings which have refurbished during the financial year. This will enable benchmark members to closely monitor the ‘before-and-after’ effect of energy usage and the environmental effectiveness of the refurbishment. BSRIA network members can access the raw data spreadsheet on a web site. A simple process of filtering and sorting will enable network members to conduct a detailed analysis of their own properties and other properties of a similar size and operational characteristics. Confidentiality of given information is guaranteed, as members’ names are not identified, and members are issued with code numbers which are identified on the spreadsheet.
Performance indicators BSRIA’s benchmark network has collected data of ‘hard services’ only over the last five years. However, the membership is now asking for data on costs and KPIs on ‘soft services’, as many service providers offer a full turnkey facilities management package for clients. Fig. 1 highlights the cost of maintenance for three building types offices, education (which is data received from university campuses in London) and business-critical buildings (such as data centres and financial institutes running 24/7). Fig. 2 indicates costs associated with maintenance per square metre using net useable area for data sets returned with office stated as the function of the building. The figure is split between three building sizes — less than 10 000 m2, 10 000 to 30 000 m2 and greater than 30 000 m2
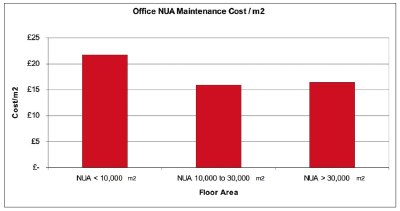
Fig. 2: Maintenance costs for office buildings in three ranges of net usable area.
Fig. 3 highlights the cost of energy for five building types. The research facility (which is comparable to a production facility) is a high user of energy, being almost twice as expensive as a 24/7 business-critical building.
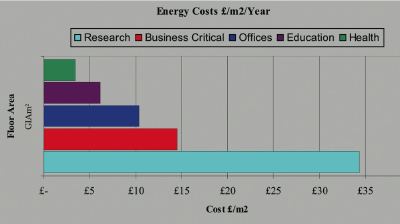
Fig. 3: How do your energy costs compare? BSRIA has compiled these figures for a range of building types.
A key objective of the network is to produce KPI wall charts for the operation and maintenance of buildings — similar to those for M&E contractors already produced by BSRIA and used within the construction industry.
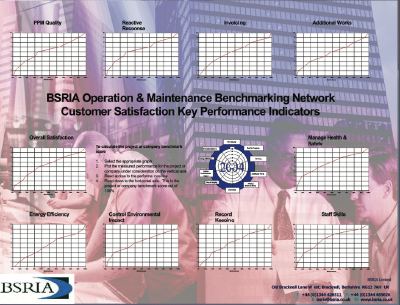
Fig. 4: Facilities managers can assess their performance using this customer satisfaction wall chart.
Data is gathered using questionnaires and completed by members per contract/building. In some cases it is possible to easily identify contracts that are under-performing in the eyes of the client or building owner/occupier. Service providers can plot these discrepancies on a graph and radar diagram (Fig. 5).
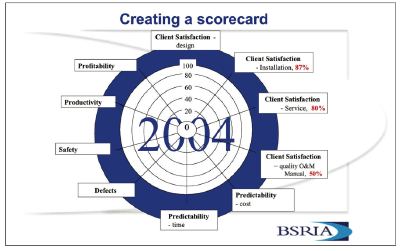
Fig. 5: This ‘radar’ chart provides a succinct summary of performance that can be included in a client report.
Our network has produced a client satisfaction KPI wall chart that comprises the following 10 benchmarks. 1. Planned maintenance quality 2. Reactive maintenance response time 3. Invoicing 4. Additional works 5. Managing health and safety 6. Staff skills, competency and appearance 7. Managing documentation and record keeping 8. Managing environmental impact 9. Energy efficiency 10. Overall satisfaction. Facilities managers use the client-satisfaction KPI wall chart (Fig. 4) to evaluate the performance of their in-house teams and/or their service providers against others in the network. The exercise encourages improvement in performance between sites. In the longer term it is hoped that service providers will use the data when re-tendering contracts to highlight their level of customer satisfaction against industry benchmark. This KPI wall chart will be regularly updated to allow for comparison of the past and present performance of service providers. This information in a visual format would be acceptable to include in a client report to present a proactive approach by the service provider in providing information related to constant performance measurement.
Moving forward The group has plans for moving forward and has defined four main goals for 2005. • Face to face meetings with network members to facilitate data gathering. • Inclusion of ‘soft services’ data gathering for benchmarking FM services. • Special-interest group workshops at seminars four times a year to improve networking and participation in data analysis. • Customer-satisfaction survey sent to non-benchmark network organisations to develop industry-standard KPIs.
Paddy Hastings is with the Design & FM Innovation Centre at BSRIA, Old Bracknell Lane West, Bracknell, Berks RG12 7AH.
Related links:
Related articles: